
Data Analytics Case Study: Screen Time Management to Boost Productivity (12/18/2023)
In the pursuit of optimizing productivity and achieving a healthier digital lifestyle, I embarked on a journey to analyze and manage my screen time habits. Over the past three weeks, I've meticulously tracked my phone usage, categorizing activities into social, entertainment, and productivity/finance uses. This endeavor serves as the capstone project for my Google Data Analytics Certification with Coursera, utilizing Google Sheets for data logging.
Background:
I initiated this study on November 26th, focusing on understanding how different categories of screen time impact my overall productivity. The primary goal is to gain insights into my usage patterns and make informed decisions to enhance my digital well-being.
Data Collection:
Using Google Sheets, I logged daily entries for social, entertainment, and productivity/finance categories. Each entry includes details on the time spent in each category, allowing for a comprehensive analysis of my screen time habits.
Data Cleaning and Preprocessing:
To ensure the accuracy and reliability of the data, I performed the following data cleaning and preprocessing steps:
Handling Missing Data:
Checked for missing entries and addressed any gaps in the data collection process.
Time Format Standardization:
Ensured consistent time format across all entries for easy comparison and analysis.
Challenges Encountered:
A challenge was encountered in determining the appropriate handling of missing data, especially when certain activities were not logged. Decisions were made to impute missing values based on daily averages.
Exploratory Data Analysis (EDA):
During the EDA phase, I sought to uncover key statistics, trends, and patterns in my screen time data:
Daily and Weekly Trends:
Identified variations in screen time across different days of the week. Examined any noticeable patterns in usage during specific hours.

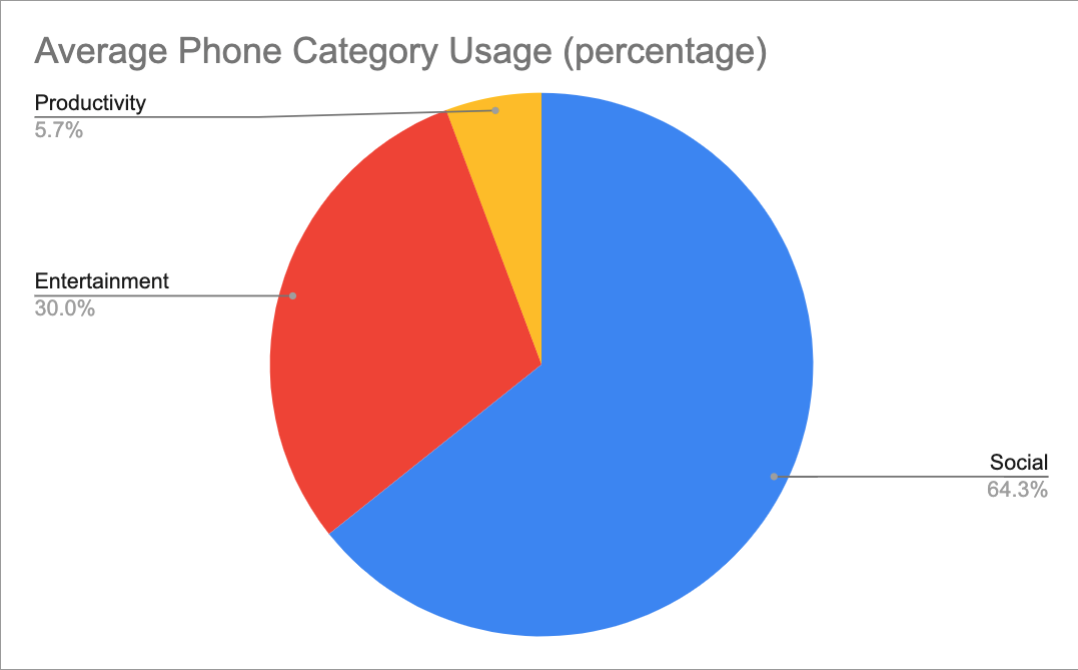
Category Distribution:
Visualized the distribution of time across social, entertainment, and productivity/finance categories. Utilized pie charts and bar graphs to illustrate the relative proportions.
Correlations:
Explored correlations between social and entertainment usage and identified potential relationships with productivity.
Hypotheses and Questions:
Formulating hypotheses and questions guided the analysis and provided a structured approach to the investigation:
Hypothesis 1:
Hypothesis: Increased social media usage is negatively correlated with productivity. Rationale: The assumption is that excessive time on social platforms may lead to distractions and a decline in productivity.
Hypothesis 2:
Hypothesis: Certain days of the week exhibit higher screen time. Rationale: If there is a consistent pattern, it could inform the implementation of stricter screen time limits on those days.
Question 1:
Question: Does the specific entertainment platform dominating usage correlate with overall screen time? Rationale: Identifying the key entertainment platform can inform targeted interventions for reduction.
Key Insights:
Social Dominance:
Analysis reveals that social activities dominate my screen time, indicating a significant portion of my day is spent on social platforms.
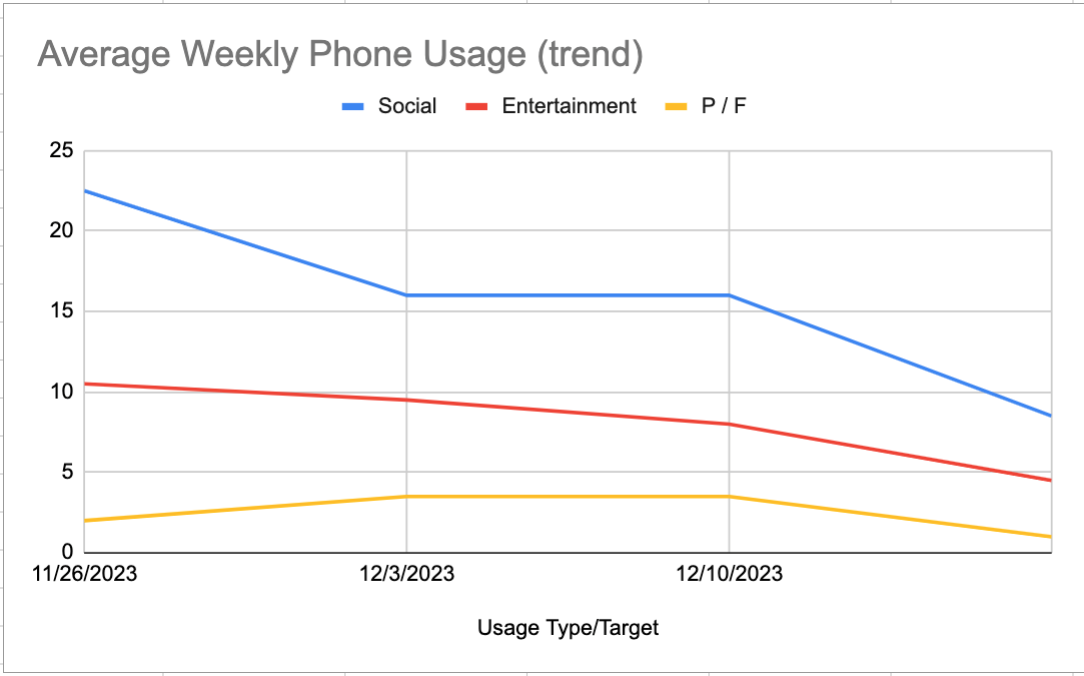
Consistent Productivity Values:
Productivity and finance-related usage show consistent values over the three-week period, suggesting a stable routine in these areas.
Entertainment Platform Dominance:
One specific platform stands out in the entertainment category, indicating a potential focal point for intervention.
Recommendations:
Set App Limits:
To address excessive social and entertainment usage, I plan to set app limits for these categories to 1 hour and 20 minutes daily. This will encourage more mindful engagement and create room for other activities.
Exceed Productivity Limits:
Recognizing the consistency in productivity values, I aim to exceed the current limits in this category. This could involve setting ambitious goals for daily tasks and projects to capitalize on the stable routine.
Explore Daily Habits:
The unaccounted time in my daily routine poses an opportunity for improvement. By delving into the specifics of these periods, I can identify and enhance daily habits, ensuring a more structured and intentional use of my time.
Implications:
The practical implications of the findings extend beyond the scope of this analysis:
Behavioral Adjustments:
Insights into social and entertainment dominance can guide intentional behavior adjustments, fostering a more balanced digital lifestyle.
Time Management Strategies:
Understanding daily and weekly trends allows for the development of targeted time management strategies, ensuring maximum productivity during peak hours.
App Limit Settings:
Implementing app limits on social and entertainment categories aligns with the goal of fostering mindfulness and reducing screen time.
Conclusion:
This case study not only serves as a capstone project for my certification but also provides valuable insights into my screen time habits. By implementing the recommended changes based on data-driven decisions, I anticipate a more balanced and purposeful use of my digital devices, ultimately enhancing my overall productivity.
Acknowledgments:
I extend my gratitude to the Google Data Analytics Certification program on Coursera for providing the knowledge and skills necessary to conduct this analysis.
Copyright © Russell. Made with HTML & CSS